
After successfully navigating the perilous path of CRAN submission, I’m pleased to announce that NeuralNetTools is now available! From the description file, the package provides visualization and analysis tools to aid in the interpretation of neural networks, including functions for plotting, variable importance, and sensitivity analyses. I’ve written at length about each of these functions (see here, here, and here), so I’ll only provide an overview in this post. Most of these functions have remained unchanged since I initially described them, with one important change for the Garson function. Rather than reporting variable importance as -1 to 1 for each variable, I’ve returned to the original method that reports importance as 0 to 1. I was getting inconsistent results after toying around with some additional examples and decided the original method was a safer approach for the package. The modified version can still be installed from my GitHub gist. The development version of the package is also available on GitHub. Please use the development page to report issues.
The package is fairly small but I think the functions that have been included can help immensely in evaluating neural network results. The main functions include:
plotnet: Plot a neural interpretation diagram for a neural network object, original blog post here# install, load package install.packages(NeuralNetTools) library(NeuralNetTools) # create model library(neuralnet) AND <- c(rep(0, 7), 1) OR <- c(0, rep(1, 7)) binary_data <- data.frame(expand.grid(c(0, 1), c(0, 1), c(0, 1)), AND, OR) mod <- neuralnet(AND + OR ~ Var1 + Var2 + Var3, binary_data, hidden = c(6, 12, 8), rep = 10, err.fct = 'ce', linear.output = FALSE) # plotnet par(mar = numeric(4), family = 'serif') plotnet(mod, alpha = 0.6)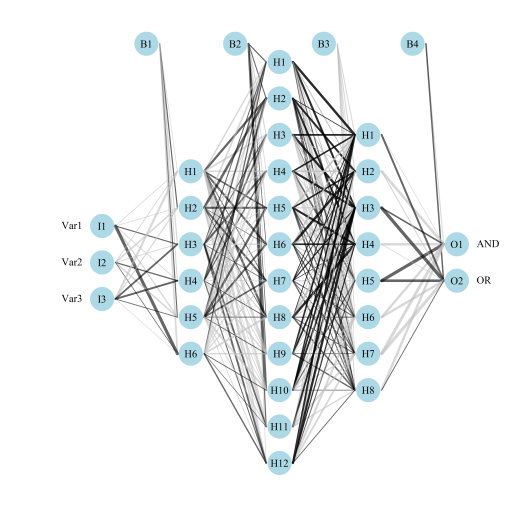
Fig: Using the plotnetfunction.garson: Relative importance of input variables in neural networks using Garson’s algorithm, original blog post here# create model library(RSNNS) data(neuraldat) x <- neuraldat[, c('X1', 'X2', 'X3')] y <- neuraldat[, 'Y1'] mod <- mlp(x, y, size = 5) # garson garson(mod, 'Y1')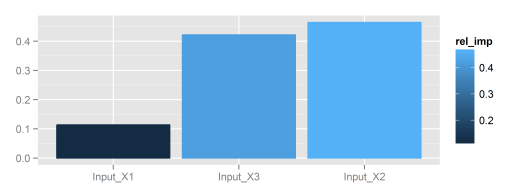
Fig: Using the garsonfunction.lekprofile: Conduct a sensitivity analysis of model responses in a neural network to input variables using Lek’s profile method, original blog post here# create model library(nnet) data(neuraldat) mod <- nnet(Y1 ~ X1 + X2 + X3, data = neuraldat, size = 5) # lekprofile lekprofile(mod)
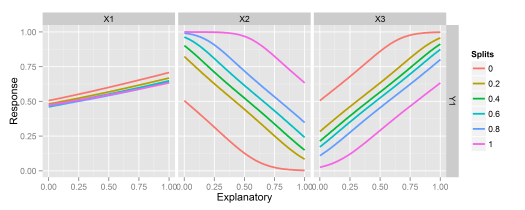
Fig: Using the lekprofilefunction.
A few other functions are available that are helpers to the main functions. See the documentation for a full list.
All the functions have S3 methods for most of the neural network classes available in R, making them quite flexible. This includes methods for nnet models from the nnet package, mlp models from the RSNNS package, nn models from the neuralnet package, and train models from the caret package. The functions also have methods for numeric vectors if the user prefers inputting raw weight vectors for each function, as for neural network models created outside of R.
Huge thanks to Hadley Wickham for his packages that have helped immensely with this process, namely devtools and roxygen2. I also relied extensively on his new web book for package development. Any feedback regarding NeuralNetTools or its further development is appreciated!
Cheers,
Marcus

I found 2 small mistakes at the beginning of the example code:
install.packages(‘NeuralNetTools’) # quotes
library(neuralnet) # load package to call function neuralnet()
Ah my mistake, these packages are installed with NeuralNetTools but not loaded. They’re not needed to use the package but of course you need them to create neural networks!
Condensed News | Data Analytics & R
Wonderful package, thanks!
I think that it would be useful if the documentation said that the first value in each layer is the bias (I found this info somewhere in your blog).
Hi Kinetic, thanks and I’m glad you like the package. The documentation for the
neuralweightsfunction describes the order of the weights that are returned by the function. I’ve added some text to the help file to make this more clear. You can download the development version of this package to see the changes:library(devtools) install_github('fawda123/NeuralNetTools')The following was added to the
neuralweightshelp file:For example, the elements in a list item for ‘hidden 1 1’ of a neural network with a 3 5 1 structure (3 inputs, 5 hidden nodes, 1 output) would have four values indicating the weights in sequence from the bias layer, first input layer, second input layer, and third input layer going to the first hidden node.
I am writing a package that would allow me to fit a neural network on any acyclic graph structure. The underlying data structure is igraph. Could I get your package to work on an igraph or graphNEL data structure?
Hi Robert,
I haven’t used igraph at all, but in hindsight, it looks like a more straightforward approach to plotting neural networks. The
plotnetfunction in my package uses base graphics… kind of old school, though I certainly see the benefit of tapping into some of these newer packages like igraph. I suspect that the plotting functions in my package would have to be reworked quite a bit, but this would definitely be a neat addition. I’ll consider it for future updates, but it definitely will not work in the current version.-Marcus
Hi Marcus,
This is very nice job!
I am working with a package that will give me MLP Neural weights, but anything more than 1 Layer and I am having trouble passing the weights in the right structure for plotting and the other functions.
In your example for using numeric input weights and structure, you only have 1 layer. Is it possible to explain how would one pass the wts_in for multiple layers?
Thanks a lot, and congrats!
Hi Marcos, maybe this example helps? I created a neural network with multiple hidden layers, then extracted the weights to show how they would look for a numeric input. You will have to install the development version of the package for this to work. The names for the elements in the ‘wts’ object should provide some clues. You’ll also notice that the plot for the original model is identical (except for the labels) for the plot from the numeric inputs.
## devtools::install_github('fawda123/NeuralNetTools') library(NeuralNetTools) library(neuralnet) ## create data for teh example AND <- c(rep(0, 7), 1) OR <- c(0, rep(1, 7)) binary_data <- data.frame(expand.grid(c(0, 1), c(0, 1), c(0, 1)), AND, OR) # a neural network with two hidden layers, first has two nodes, second has three nodes mod <- neuralnet(AND + OR ~ Var1 + Var2 + Var3, binary_data, hidden = c(2, 3), rep = 10, err.fct = 'ce', linear.output = FALSE) # get the weights and structure in the right format wts <- neuralweights(mod) struct <- wts$struct wts <- unlist(wts$wts) # plot plotnet(wts, struct = struct)Marcus,
Thank you so much for this work. Last year I was happy to discover your plot.nnet code before teaching my students (at an R certificate program, University of Washington) neural nets. It was extremely useful.
It’s even greater that you made it into a package now! Yes, from experience getting into CRAN *is* almost always worth the hassle.
All the best, Assaf
Hi Assaf, thanks for reading! It’s always good to hear that my packages are being used.
A great package, thank you very much!
I recently published a paper on Garson’s and Olden’s connection weight methods in Ecological Modelling that may be of interest to you because it sheds a new light on both methods (see http://www.sciencedirect.com/science/article/pii/S0304380015001660). Maybe it helps explaining some of the inconsistent results you obtained with your prior version of Garson’s method.
Thanks Andreas, interesting paper. Am I correct in understanding that you looked only at the rank orders for each method? I think a descriptive advantage of Olden’s technique is the ability to describe both magnitude and sign of importance, whereas Garson’s only describes magnitude. It may also be interesting to add a random error component to each of your linear models. If I’m understanding correctly, it looks like you’ve made Y a linear combination of the X variables with no error component.
Hi Marcus,
I looked at both rank orders (see Table 1) and mean-values (see Figure 1) and I examined both linear and nonlinear relations between Y and the X variables.
I also tried adding error components as well as correlations between the X variables, but this did not change the results, so I decided to keep it simple: In case of non-monotonic effects (e.g., equations 2 and 3) magnitudes, signs and rank order of Olden’s coefficients were often wrong, whereas Garson’s coefficients adequately represented the relative importance of variables in each of the datasets simulated (i.e., even in case of non-monotonic relations).
If I am trying to apply your olden-method to a nnet with only one hidden-unit, the following error occurs (whereas it works fine in case of more hidden-units):
Error in rowSums(sum_in) :
‘x’ must be an array of at least two dimensions
Hi Andreas, can you please post an issue on the development page, including an example that reproduces the error?
https://github.com/fawda123/NeuralNetTools/issues
Thanks,
Marcus
Hi Marcus,
How do I use lekprofile method for the object that was created using h2o package?
When I am trying to use lekprofile method as
lekprofile(h2o_model1,xvar=dat_h2o[,1:10],yvar=dat_h2o[,11])
Error that I am receiving is:
Error in is.finite(from) : default method not implemented for type ‘S4’
I appreciate if you could please help me this regard.
Many thanks
Suneetha
Dear Sir,
Your articles are very helpful for me. And, I have two output nodes, but garson only applies to neural networks with one output node. What should i do?
Hi, download the latest version of NeuralNetTools from CRAN and try using the ‘olden’ function. It’s similar to ‘garson’ but can evaluate more than one output node. You will have to change the ‘out_var’ argument which tells the function which output node to evaluate.
-Marcus
Hi Marcus,
very nice package! I am installing it right now.
Just a couple of question for you:
1) as I understand it seems like that some functions are fine with multilayer networks but others (e.g. garson and lekprofile), are you planning to extend their functionalities in the next future? And,
2) in regards to lekprofile, I think the function should allow multirow multi-plots depending on the number of explanatory variables considered. Or should give the possibility to the user to re-plot the output as he/she prefers. What do you think about this?
Many thanks,
Federico
Hi Federico, glad you are finding the package useful. For your first question, the Garson method was developed to work with networks having only one layer. I don’t believe the original method was ever intended to be extended to multilayer networks. I remember exploring this a few years ago and not finding it possible. Personally, I think the olden method provides a more informative summary of variable importance and it can evaluate multilayer networks. The lekprofile should work fine with networks having more than one layer. For your second question, I’m not sure I follow exactly. If you are talking about giving the user flexibility in the layout of the plot, I’ve provided an argument in lekprofile that returns the raw values. These can be used to create your own plot, as an example:
library(ggplot2)
library(NeuralNetTools)
library(nnet)
library(clusterGeneration)

#define number of variables and observations
set.seed(2)
num.vars<-8
num.obs<-10000

#define correlation matrix for explanatory variables
#define actual parameter values
cov.mat<-genPositiveDefMat(num.vars,covMethod=c("unifcorrmat"))$Sigma
rand.vars<-mvrnorm(num.obs,rep(0,num.vars),Sigma=cov.mat)
parms1<-runif(num.vars,-10,10)
y1<-rand.vars %*% matrix(parms1) + rnorm(num.obs,sd=20)
parms2<-runif(num.vars,-10,10)
y2<-rand.vars %*% matrix(parms2) + rnorm(num.obs,sd=20)

#prep data and create neural network
rand.vars<-data.frame(rand.vars)
resp<-apply(cbind(y1,y2),2, function(y) (y-min(y))/(max(y)-min(y)))
resp<-data.frame(resp)
names(resp)<-c('Y1','Y2')
mod1<-nnet(rand.vars,resp,size=8,linout=T)

# get raw data from lekprofile
rawdat <- lekprofile(mod1, val_out = T)[[1]]

# make your own plot
ggplot(rawdat, aes(x = Explanatory, y = Response, group = Groups, colour = Groups)) +
  geom_line() +
  facet_wrap(resp_name ~ exp_name)
Cheers,
Marcus
Thanks Marcus,
in fact I read the article by Garson and documentation of the package only after posting my comment. Sorry about that.
Thanks a lot for your help and support with this!
Good job!
Best,
Federico